
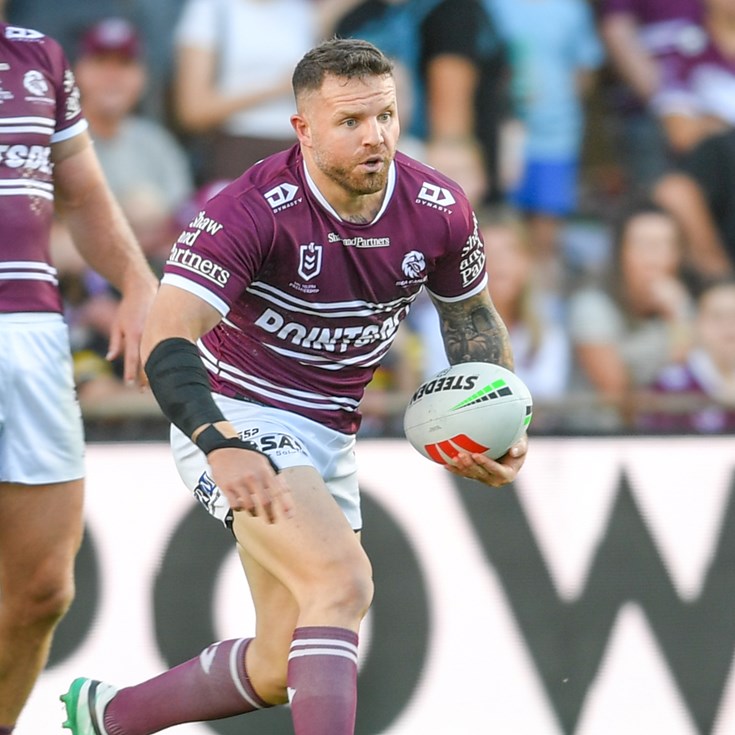
Nathan Brown
Lock
Player Bio
- Height:
- 185 cm
- Date of Birth:
- 01 March 1993
- Weight:
- 104 kg
- Birthplace:
- Fairfield, NSW
- Age:
- 33
- Nickname:
- Browny
- Debut Club:
- Wests Tigers
- Date:
- 24 August 2013
- Opposition:
- St. George Illawarra Dragons
- Round:
- 24
- Previous Clubs:
- Wests Tigers, South Sydney Rabbitohs, Parramatta Eels, Sydney Roosters
- Junior Club:
- -
- Biography:
Nathan Brown earned plenty of admirers in his first season at Manly when arriving at the Club on a train and trial deal in 2024.
He was rewarded for his consistently strong performances with a new contract that keeps him at the Sea Eagles until the end of 2026.
As one of the smaller middle forwards in the game, Brown brings energy, aggression and a wealth of experience to the team.
He gained selection for NSW in the 2020 State of Origin series when in his fourth season at Parramatta, seven years after making his NRL debut with the Wests Tigers.
Career
- Appearances
- 190
- Tries
- 8
2026 Season
- Appearances
- 8
Scoring
- Tries
- 0
Attack
- Tackle Breaks
- 8
- Average Hit Ups
- 7.9
- Post Contact Metres
- 178.5
Passing
- Offloads
- 1
Defence
- Tackles Made
- 129
- Tackle Efficiency
-
Running Metres
- Average Running Metres
- 81
- Total Running Metres
- 652
Fantasy
- Total Points
- 188
- Average Points
- 23.5
2026 Season - By Round
| Round | Opponent | Score | Position | Minutes Played | Tries | Goals | 1 Point Field Goals | 2 Point Field Goals | Points | Try Assists | Linebreaks | Tackle Breaks | Post Contact Metres | Offloads | Receipts | Tackles Made | Missed Tackles | Total Running Metres | Hit Up Running Metres | Kick Return Metres | |
|---|---|---|---|---|---|---|---|---|---|---|---|---|---|---|---|---|---|---|---|---|---|
| 1 | Raiders | Lost | 28 - 29 | Interchange | 22 | - | - | - | - | - | - | - | - | 4 | - | 7 | 18 | 4 | 25 | 19 | - |
| 2 | Knights | Lost | 16 - 36 | Interchange | 14 | - | - | - | - | - | - | - | - | 10 | - | 7 | 9 | - | 28 | 28 | - |
| 9 | Panthers | Lost | 18 - 16 | Interchange | 29 | - | - | - | - | - | - | - | 1 | 19 | - | 17 | 14 | 1 | 63 | 49 | 13 |
| 10 | Broncos | Won | 32 - 4 | Interchange | 30 | - | - | - | - | - | 1 | - | 1 | 27 | - | 14 | 14 | 1 | 106 | 81 | 13 |
| 11 | Wests Tigers | Won | 18 - 46 | Interchange | 43 | - | - | - | - | - | - | - | 1 | 26 | - | 26 | 21 | 3 | 124 | 83 | 18 |
| 12 | Titans | Won | 12 - 10 | Interchange | 48 | - | - | - | - | - | - | - | 2 | 41 | 1 | 23 | 20 | 2 | 111 | 100 | - |
| 13 | Sharks | Lost | 28 - 22 | Interchange | 32 | - | - | - | - | - | - | - | - | 18 | - | 10 | 19 | 2 | 67 | 67 | - |
| 14 | Rabbitohs | Won | 28 - 14 | Interchange | 31 | - | - | - | - | - | - | - | 3 | 34 | - | 18 | 14 | 1 | 125 | 110 | 7 |
Career By Season
| Year | Played | Won | Lost | Drawn | Win % | Tries | Goals | 1 Point Field Goals | 2 Point Field Goals | Points | Kicking Metres | Kicking Metres Average | Forced Drop Outs | Tackle Breaks | Post Contact Metres | Offloads | Tackles Made | Missed Tackles | Tackle Efficiency | Total Running Metres | Average Running Metres | Kick Return Metres | Total Points | Average Points | |
|---|---|---|---|---|---|---|---|---|---|---|---|---|---|---|---|---|---|---|---|---|---|---|---|---|---|
| Wests Tigers | 2013 | 1 | 1 | - | - | 100% | - | - | - | - | - | - | - | - | 1 | 8 | 1 | 11 | - | 91.70% | 30 | 30.00 | 11 | 15 | 15.0 |
| Rabbitohs | 2015 | 7 | 3 | 4 | - | 43% | - | - | - | - | - | - | - | - | 5 | 158 | 2 | 110 | 3 | 97.35% | 366 | 52.00 | - | 160 | 22.9 |
| Rabbitohs | 2016 | 21 | 7 | 14 | - | 33% | 1 | - | - | - | 4 | 19 | 0.89 | 1 | 21 | 544 | 36 | 567 | 25 | 94.39% | 1,978 | 94.00 | 243 | 822 | 39.1 |
| Eels | 2017 | 25 | 15 | 10 | - | 60% | 1 | - | - | - | 4 | 19 | 0.77 | - | 41 | 1,229 | 43 | 881 | 62 | 93.43% | 3,832 | 153.00 | 121 | 1,301 | 52.0 |
| Eels | 2018 | 15 | 4 | 11 | - | 27% | 1 | - | - | - | 4 | - | - | - | 21 | 840 | 15 | 549 | 26 | 95.48% | 2,353 | 156.00 | 77 | 797 | 53.1 |
| Eels | 2019 | 13 | 9 | 4 | - | 69% | 1 | - | - | - | 4 | 21 | 1.60 | 1 | 12 | 489 | 12 | 394 | 27 | 93.59% | 1,774 | 136.00 | 55 | 574 | 44.2 |
| Eels | 2020 | 18 | 11 | 7 | - | 61% | 1 | - | - | - | 4 | - | - | - | 22 | 1,069 | 30 | 664 | 47 | 93.39% | 2,853 | 158.00 | 130 | 966 | 53.7 |
| Eels | 2021 | 24 | 15 | 9 | - | 62% | 1 | - | - | - | 4 | - | - | - | 20 | 940 | 18 | 745 | 61 | 92.43% | 3,104 | 129.00 | 77 | 1,030 | 42.9 |
| Eels | 2022 | 14 | 8 | 6 | - | 57% | 1 | - | - | - | 4 | - | - | - | 7 | 575 | 11 | 360 | 28 | 92.78% | 1,469 | 104.00 | - | 500 | 35.7 |
| Roosters | 2023 | 10 | 4 | 6 | - | 40% | - | - | - | - | - | - | - | - | 5 | 230 | 9 | 216 | 23 | 90.38% | 778 | 77.00 | - | 278 | 27.8 |
| Sea Eagles | 2024 | 22 | 13 | 9 | - | 59% | - | - | - | - | - | - | - | - | 23 | 736 | 12 | 498 | 62 | 88.93% | 2,481 | 112.00 | 265 | 675 | 30.7 |
| Sea Eagles | 2025 | 12 | 5 | 7 | - | 42% | 1 | - | - | - | 4 | - | - | - | 6 | 279 | 7 | 241 | 17 | 93.41% | 911 | 75.00 | 77 | 331 | 27.6 |
| Sea Eagles | 2026 | 8 | 4 | 4 | - | 50% | - | - | - | - | - | - | - | - | 8 | 178 | 1 | 129 | 14 | 90.21% | 652 | 81.00 | 52 | 188 | 23.5 |
Career Overall
| Year Start | Year End | Played | Won | Lost | Drawn | Win % | Tries | Goals | 1 Point Field Goals | 2 Point Field Goals | Points | Kicking Metres | Kicking Metres Average | Forced Drop Outs | Tackle Breaks | Post Contact Metres | Offloads | Tackles Made | Missed Tackles | Tackle Efficiency | Total Running Metres | Average Running Metres | Kick Return Metres | Total Points | Average Points | |
|---|---|---|---|---|---|---|---|---|---|---|---|---|---|---|---|---|---|---|---|---|---|---|---|---|---|---|
| Wests Tigers | 2013 | 2013 | 1 | 1 | - | - | 100% | - | - | - | - | - | - | - | - | 1 | 8 | 1 | 11 | - | 100.00% | 30 | 30.00 | 11 | 14 | 14.0 |
| Rabbitohs | 2015 | 2016 | 28 | 10 | 18 | - | 36% | 1 | - | - | - | 4 | 19 | 0.66 | 1 | 26 | 701 | 38 | 677 | 28 | 96.03% | 2,344 | 83.00 | 243 | 982 | 35.1 |
| Eels | 2017 | 2022 | 109 | 62 | 47 | - | 57% | 6 | - | - | - | 24 | 40 | 0.36 | 1 | 123 | 5,112 | 129 | 3,593 | 251 | 93.47% | 15,338 | 139.00 | 462 | 5,163 | 47.4 |
| Roosters | 2023 | 2023 | 10 | 4 | 6 | - | 40% | - | - | - | - | - | - | - | - | 5 | 230 | 9 | 216 | 23 | 90.38% | 778 | 77.00 | - | 278 | 27.8 |
| Sea Eagles | 2024 | 2026 | 42 | 22 | 20 | - | 52% | 1 | - | - | - | 4 | - | - | - | 37 | 1,194 | 20 | 868 | 93 | 90.32% | 4,045 | 96.00 | 394 | 1,194 | 28.4 |
Latest


Team Mates


Manly Warringah Sea Eagles respect and honour the Traditional Custodians of the land and pay our respects to their Elders past, present and future. We acknowledge the stories, traditions and living cultures of Aboriginal and Torres Strait Islander peoples on the lands we meet, gather and play on.